Astrometrical and photometrical observations of extragalactic
radio-sources with the Valinhos
CCD meridian circle
R. Teixeira, T. P. Dominici, A. Galo, W. Monteiro,
A.M. Cunha and P. Benevides-Soares
Instituto Astronômico e Geofísico –
Universidade de São Paulo, Brazil
Introduction
With the CCD meridian circle at Valinhos Observatory differential
astrometrical and photometrical observations of more than ten thousand
stars per night, down to V=16.0 magnitudes, became feasible.
The astrometrical and photometrical precisions are about
50 mas in both coordinates and 0.05 magnitudes.
Since 1996 we have been regularly observed some bright
extragalactic radio-source belong to the ICRF. These observations aim the
definition of the proper motion origin, the highest accuracy possible in
the linking between the extragalactic reference frame and star positions
and the photometrical variability.
Instrument – observation
-
The camera (-40o C) operates in drift-scan mode
with the telescope fixed in declination
-
Telescope: achromatic doublet, D=0.19m, F=2.60m
-
Detector: Thomson 7895M CCD 512x512 pixels
-
Pixel size = 19 microns (~1.5 arcsec)
-
Field: declination = 13 arcmin
-
Exposure time = 51ssec(delta)
-
Filter GG495+BG38: spectral passband 5200Å-6800Å
Reduction
-
Images fitted by a bi-dimensional gaussian
-
For a field observed on several nights, a solution is obtained
by fitting the coordinates of the reference stars with a first degree polynomial
depending on the mesured X and Y;
alpha = a + b X + c Y
delta = a’ + b’ Y + c’ X
-
The solution is improved by extending the model to all objects
and interating towards the global reduction;
-
The observed flux is used to estimate the magnitudes by means
of
mV = K – 2.5log(Flux)
Instrument limits
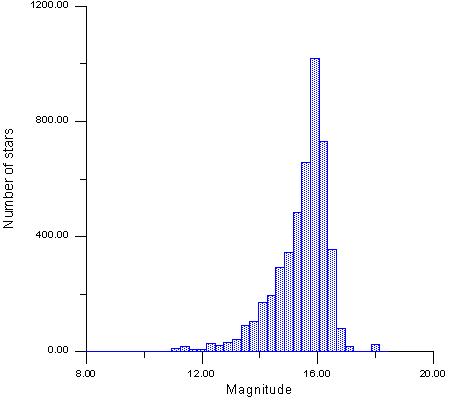
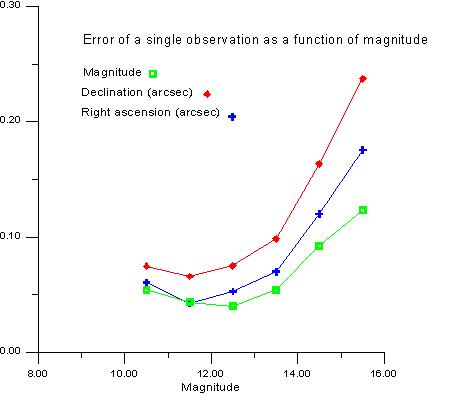
The following figures show our magnitude limit and
the astrometric and the photometric internal errors as a function of the
magnitude.

 Astrometrical and photometrical mesurements
The following table and figures show our astrometrical
and photometrical results for some bright extragalactic objects.
In the table we can see a comparison between the optical
and radio positions. The optical positions were reduced in the Tycho reference
frame.
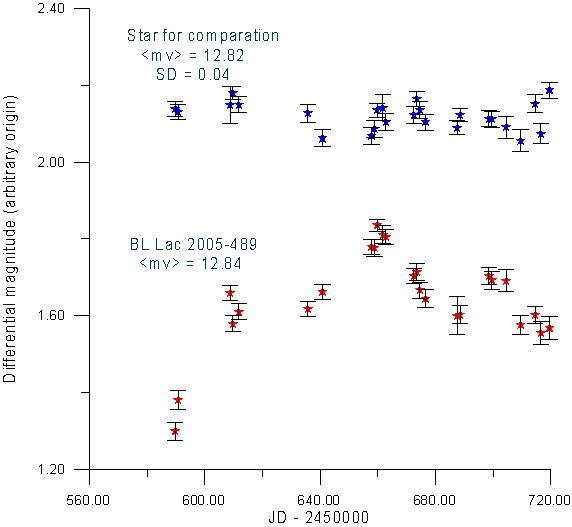
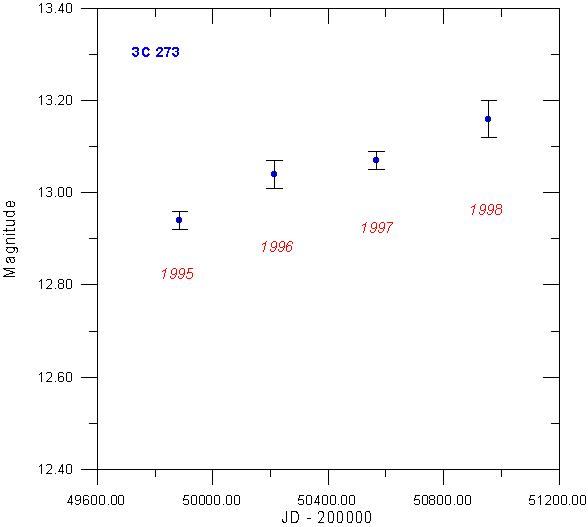
In the figures we show the light curves for the BL Lac
2005-489 observed in 1997, and for the quasar 3C273 observed in 1995, 1996,
1997 and 1998. In this case, each point represents the mean magnitude for
the year.
(CCD – radio) differences
|
Object
|

|

|
 ('')
('')
|
 ('') ('')
|
V
|
N
|
|
0007+106
|
00h 11m
|
10o 58’
|
0.332+/-0.046
|
0.032+/-0.081
|
15.4
|
05
|
|
0109+224
|
01 12
|
22 45
|
-0.221+/-0.103
|
-0.454+/-0.122
|
15.7
|
03
|
|
0851+202
|
08 55
|
20 07
|
-0.266+/-0.135
|
0.004+/-0.124
|
16.0
|
02
|
|
1101+384
|
11 04
|
38 13
|
-0.105+/-0.049
|
-0.084+/-0.086
|
13.1
|
14
|
|
1156+295
|
11 59
|
29 15
|
0.077+/-0.169
|
0.014+/-0.219
|
15.0
|
08
|
|
1215+303
|
12 17
|
30 07
|
-0.156+/-0.061
|
-0.270+/-0.082
|
15.1
|
02
|
|
1226+023
|
12 29
|
02 03
|
0.022+/-0.037
|
-0.027+/-0.057
|
13.0
|
40
|
|
1302-102
|
13 06
|
-10 33
|
0.353+/-0.059
|
-0.039+/-0.051
|
15.1
|
06
|
|
1355-416
|
13 59
|
-41 53
|
0.045+/-0.364
|
-0.258+/-0.239
|
15.7
|
03
|
|
1404+286
|
14 07
|
28 27
|
0.277+/-0.200
|
-0.095+/-0.166
|
15.6
|
07
|
|
1424+240
|
14 27
|
23 48
|
0.132+/-0.051
|
0.024+/-0.056
|
14.5
|
18
|
|
1514-241
|
15 18
|
-24 22
|
0.189+/-0.037
|
0.057+/-0.054
|
14.7
|
10
|
|
2005-489
|
20 09
|
-48 50
|
0.012+/-0.024
|
-0.015+/-0.032
|
13.2
|
33
|
|
2128-123
|
21 32
|
-12 07
|
-0.104+/-0.093
|
0.249+/-0.273
|
15.4
|
04
|
|
2155-304
|
21 52
|
-30 14
|
0.083+/-0.039
|
0.021+/-0.034
|
13.0
|
06
|
|
2201+315
|
22 03
|
31 46
|
0.043+/-0.075
|
-0.207+/-0.129
|
15.8
|
03
|

